matplotlibでplotの線にグラデーションで色を付けたくなった。
scatterで点にしてプロットする方法はあったのだけど、点ではなく線でちゃんとプロットしたいと思った。
LineCollectionで線をプロットするとよいという事が分かったので、こちらを解説する。
まずはサンプルコードがこちら。
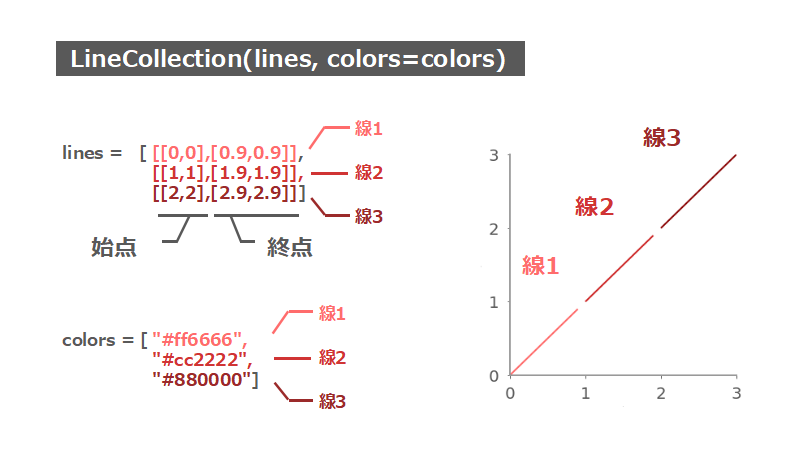
import matplotlib.pyplot as plt
import numpy as np
from matplotlib.collections import LineCollection


fig1 = plt.figure(figsize=(5,5))#グラフの作成
ax1 = fig1.add_subplot(111)#subplotの作成

#複数の線の座標を決める
lines = [[[0,0],[0.9,0.9]],
         [[1,1],[1.9,1.9]],
         [[2,2],[2.9,2.9]]]

#線の色を決める
colors = ["#ff6666","#cc2222","#880000"]

#LineCollectionでグラフに描く
lc = LineCollection(lines, colors=colors)
ax1.add_collection(lc)
↓みたいな感じで、線を複数まとめてプロットして、それぞれに色を設定することが出来る。
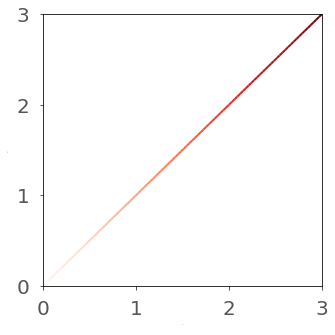
これをたくさん分割していけばグラデーションにすることが出来る。
import matplotlib.pyplot as plt
import numpy as np
from matplotlib.collections import LineCollection

fig1 = plt.figure(figsize=(5,5))#グラフの作成
ax1 = fig1.add_subplot(111)#subplotの作成

x1, y1 = 0, 0#始点
x2, y2 = 3, 3#終点
split = 100#分割数

#分割してx,yのリストを作る
a = np.linspace(x1, x2, split)#x座標のリスト
b = np.linspace(y1, y2, split)#y座標のリスト
c = np.stack((a, b), axis=1)#[[x1,y1],[x2,y2],...]のリスト

#[ [[x1,y1],[x2,y2]], [[x2,y2],[x3,y3]],...]のリスト
segments = []
for n in np.arange(len(c)-1):
    segments.append(np.array([c[n],c[n+1]]))

#LineCollectionの設定
lc = LineCollection(segments, cmap='Reds', linewidth=2)#setmentsをプロット
cols = np.linspace(0,3,split)
lc.set_array(cols)
ax1.add_collection(lc)
グラフの領域をグラデーションにしようとしたものもあります。
参考サイト
python - How to plot a gradient color line? - Stack Overflow