グラフを作るときは、アニメーションにした方が圧倒的に分かりやすくて良い。
そんなわけで今回はpythonで動くグラフを作る。
ImageMagickのインストール
まずはImageMagickというgifアニメーションを作れるソフトをインストールして、pythonで呼び出せるようにする必要がある。
その辺はこちらのサイト様とかを見て頂きたい。
【Python,matplotlib】動くグラフをAnimationGifに保存する方法 | イメージングソリューション
サンプルコード
まずはこんな感じになる。
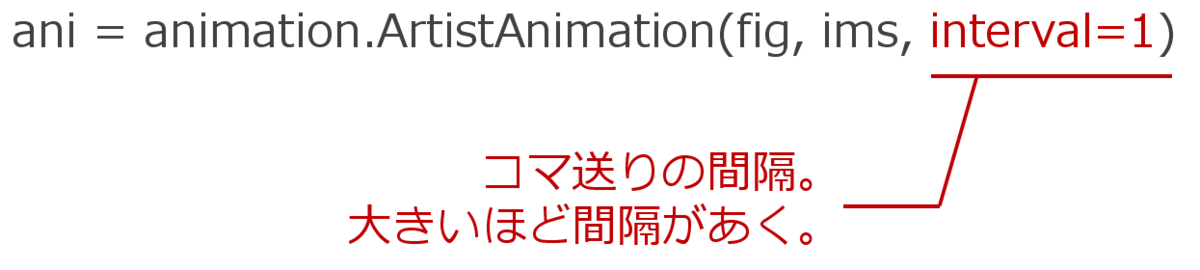
matplotlib.animationというグラフをアニメーションにする関数があり、今回はそのanimation.ArtistAnimationを使う。
import numpy as np
import matplotlib.pyplot as plt
import matplotlib.animation as animation

fig = plt.figure(figsize=(5,5))#グラフの作成
ax = fig.add_subplot(111)#subplotの作成

ims = []

for n in np.arange(100):
    im = ax.plot(n, n, marker=".", color="#555555", markersize=50)
    ims.append(im)#二つをまとめて足す

ani = animation.ArtistAnimation(fig, ims, interval=1)
ani.save("sample.gif", writer="imagemagick")

ArtistAnimationの使い方

リストに複数のaxesを格納し、ArtisAnimationで指定することでアニメーションになる。
fig = plt.figure(figsize=(5,5))#グラフの作成
ax = fig.add_subplot(211)#subplotの作成
ax2 = fig.add_subplot(212)#subplotの作成

ims = []#アニメーションにするグラフを格納するリスト

for n in np.arange(100):
    im = ax.plot(n, n, marker=".", color="#555555", markersize=50)#アニメーションにする方
    im2 = ax2.plot(n, n, marker=".", color="#aa0000", markersize=1)#アニメーションにしない方
    ims.append(im)#imをリストに格納


ani = animation.ArtistAnimation(fig, ims, interval=1)#上側のimをアニメーションにする
ani.save("sample2.gif", writer="imagemagick")
ArtistAnimationで指定した上側だけが動いて、指定しなかった下側は全てプロットされていることが分かる。
intervalを設定すると感覚が開く。
|
ininterval=1
|
interval=1000
|

今回はこんなところで。この程度は色々な記事があるのでいいとして、グラフをアニメーションにする上ですごく困ったことがあったのでそれを次の記事にまとめました。というかそれがやりたかった。