この記事でグラフがどんどん更新されていくアニメーションを作った。
せっかくなのでこれにトヨタのロゴを追加して、株価に連動して動くようにしてみた。
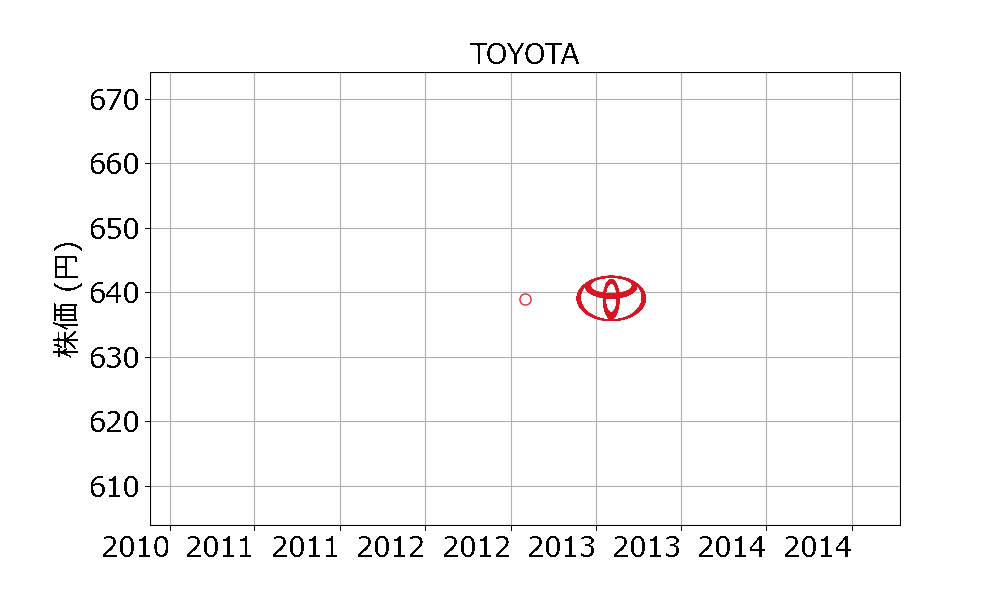
画像をグラフに貼り付けるという作業を始めてやったので結構新鮮でした。
これで企業間の比較したら結構楽しいかも。
import matplotlib.pyplot as plt
from matplotlib.animation import FuncAnimation
import yfinance as yf
import matplotlib.dates as mdates
from matplotlib.offsetbox import AnnotationBbox, OffsetImage
from matplotlib.cbook import get_sample_data

# トヨタの株価データを取得
toyota_ticker = '7203.T'
toyota_data = yf.Ticker(toyota_ticker)

# 日次の株価データを取得し」月次へ変換
toyota_hist = toyota_data.history(start='2013-01-01', end='2023-03-25').resample('M').last()

#グラフの準備
fig, ax = plt.subplots(figsize=(10, 6))
plt.rcParams['font.family'] = 'Meiryo'#フォント指定

#ロゴの 読み込み
logo_path = get_sample_data("toyota.png")
logo = plt.imread(logo_path)
imagebox = OffsetImage(logo, zoom=0.05)

def animate(i):
    ax.clear()
    # 1フレームごとのグラフ
    #株価の推移(線)
    ax.plot(toyota_hist["Close"][:i+1], marker='None', linestyle='-', color='#D72E3A')
    #最新の株価(点)
    ax.plot(toyota_hist[:i+1].index[-1], toyota_hist["Close"][:i+1].iloc[-1], marker='o', color='#D72E3A', markersize=8, markerfacecolor="white")

    #ロゴの追加
    x = toyota_hist[:i+1].index[-1]
    y = toyota_hist["Close"][:i+1].iloc[-1]
    ab = AnnotationBbox(imagebox, (x, y), frameon=False, box_alignment=(-0.7, 0.5))
    plt.gca().add_artist(ab)

    # グラフフォーマット
    ax.set_title('TOYOTA', fontsize=20)#グラフタイトル
    ax.set_ylabel('株価 (円)', fontsize=20)#Y軸ラベル
    ax.grid(True)
    ax.xaxis.set_major_formatter(mdates.DateFormatter('%Y'))#X軸ラベルを年表示に
    plt.yticks(fontsize=20)
    plt.xticks(ha="right",fontsize=20)
    plt.subplots_adjust(left=0.15)

# アニメーションの設定
pause_frames = 20#アニメーションのループの前にポーズを入れる
ani = FuncAnimation(fig, animate, frames=len(toyota_hist)+ pause_frames, interval=1)

# アニメーションの保存
ani_file_path = "toyota_stock_prices_animation.gif"
ani.save(ani_file_path, writer='imagemagick', dpi=100)